Self-Service Checkout
Introduction and Background
Self-checkouts have been a part of supermarkets for over twenty years. They are increasing in popularity; a 2008 survey found that 63% of supermarkets have self-checkouts in at least one of their stores. According to a study conducted by NCR 90% of the people surveyed described themselves as users of self-service technologies (SST) yet only 7% of those stated that they always use SST.
The aim of this study was to examine elements of the task of purchasing groceries at the self-checkout and explore possible relationships between task performance and user attitudes. While there have been many studies focusing on interviewing data with respect to user’s attitudes, intentions and behaviour, there seems to be very little research involving task analysis of observational data. In order to understand how user’s attitude toward SST relates to their experiences using the technology, a deeper understanding of task performance is needed. Through task analysis methods of users completing a transaction, a possible correlation between user experience and attitudes can be determined.
This is a summary of the report. For the full report, download the PDF here.
Methods and Results
This research was conducted through observation and interviews of 6 participants at Sainsbury’s and Tesco supermarkets. Participants completed consent forms before they were observed. Notes were recorded from each participant’s observation and throughout the research process to provide context and an audit trail. Videos were also recorded of the observations for further analysis. Participants were interviewed after they had used the self check-out and their answers were recorded with a portable recording device, as well as field notes taken by the researcher. Observational data was then analyzed using the following task analysis methods; hierarchical task analysis and link analysis to show variance between the users. A thematic analysis was completed with the interview data using NVivo. Finally, all of the data was pulled together through triangulation to better understand the task.
Sampling Strategy
Sampling was not randomized, yet created with the planning of the research. While some of the strategy included a convenience sampling, due to time constraints, careful thought was put into finding a purposive sampling of participants that would represent some diversity with age and gender in order to gain rich data. Basic demographic information of the participants was recorded. Independent samples were used at the two supermarkets.
Hierarchical Task Analysis
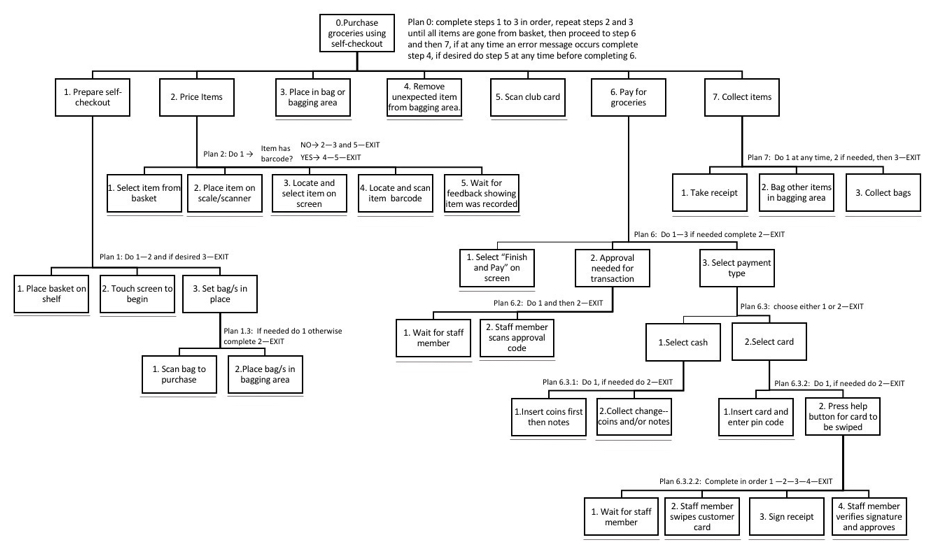
Hierarchical Task Analyses (HTA) was created by referencing field notes and video recordings collected for each of the six participants, showing how they completed the task. The stopping rule was indicated on HTA diagrams with a line underneath the plan. The tabular formats include notes, stopping rules and type of operation of a step; input, action or feedback.

Variance was clearly indicated comparing the individual user’s HTA as none of the users completed the task in the same way. The individual HTAs were simpler, with fewer plans. However, when complied, the plans became more complex and required more levels of description or a more comprehension organisation of the plans causing the structure to change. The HTA also highlights problems that users experienced during the task.
Link Analysis
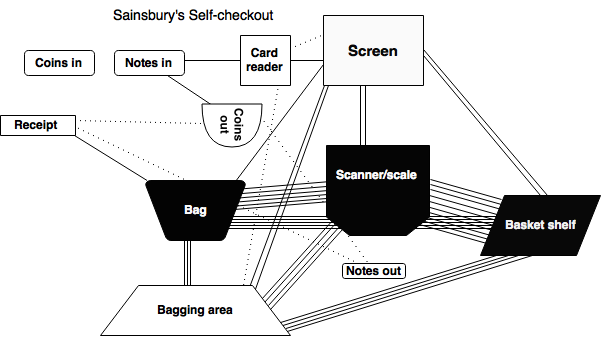
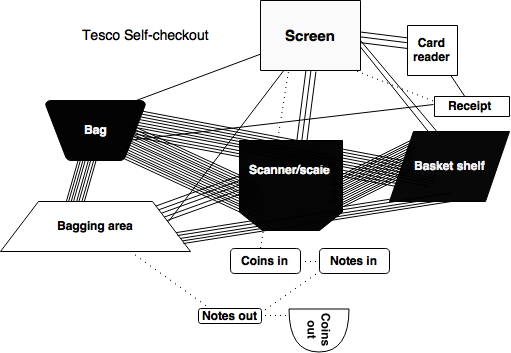
The link analysis method of task analysis was used to examine the layout of the Tesco and Sainsbury’s self-checkout machines, in order to understand task performance and compare differences between the two machines. Link analyses of the self-checkout observations were created by reviewing the video recordings of each user completing the task, as well as referencing notes. A link was defined as a movement of the hand from one area of the system to the next. The link analyses were illustrated as diagrams showing the frequency of links.

Sainsbury’s most common links were between the basket shelf and the scale/scanner as well as the bag and the scale/scanner. The layout of the Sainsbury’s system is more spread out than Tesco. Users who paid with cash had to take a few steps over to access the notes input feature of the machine. The system also has an input and output for coupons as well as a digital card signing pad, which was not used by any participant during observations.

All of the elements of Tesco’s self-checkout system are within close proximity to one another, allowing the user to easily reach them with little movement. The most frequently used links were between the basket shelf and the scale/scanner and the bag and the scale/scanner. Tesco’s system also had an input for coupons, which no participant used.
The Interviews
Initially one interview questionnaire was developed for both the Tesco and the Sainsbury’s checkout systems. After observation of both systems an addition question was added to the Tesco questionnaire to better understand users attitudes of the separate systems and future intentions to use those systems. The questionnaires were developed with mostly open-ended questions using guidelines suggested by Gray. Careful consideration was given in the questionnaire design to ensure validity with attention to word choice, question order, possible probing questions, and importance to the study. Probing was used in different ways by the researcher; first as an approach to obtain more in-depth answers about the predetermined questions. Second was to gain a better understanding of the participant’s preferences, resources they used and their attitude regarding the overall task.
After interviews were administered in a semi-structured manner they were analyzed thematically with a software application called NVivo. Thematic analysis aims to bring comprehension to data, allowing participants to describe their feelings and thoughts regarding their task performance. The interviews were transcribed from the audio recordings and exported into NVivo, where it was then coded by common themes. A tree diagram was also created with NVivo to show the themes that were coded from the interviews.
Themes identified with NVivo included; barriers, motivators, ease of use, independence, speed, SST layout, SST positive comments, SST errors, number of items, attitudes towards SST and privacy. A table was created to explore the main themes of motivators and barriers regarding the check out.
| Category Name | Illustrative Quotes | Interviewee Demographics |
|---|---|---|
| Motivators | Some of the time it's not nice to say hello to a clerk. I dn't have to make small talk ... when I'm feeling introverted. | F 40-45 |
| It's faster ... it's more private. I like being able to take care of things myself. | M 30-35 | |
| It's nice to be able to go though quickly ... the queue moves faster than a normal checkout. | F 70-75 | |
| Not feeling rushed when I'm bagging my items like someone's waiting for me to get out of the way. | F 30-35 | |
| Barriers | If I was doing a big shop I woudl go to the normal checkout. | F 20-25 |
| When I have to wait for a clear to buy things. | M 30-35 | |
| If you have fresh fruit and vegetables you have to find them on the screen ... it's a bit more complicated. | F 70-75 | |
| The uncertainty if you're going to have problems with the checkout or not. | F 30-35 |
A few users expressed frustration or dislike about the errors that can occur with the self-checkout. However, this negative feeling did not affect their overall opinion of their experience and their future intentions to use SST.
Conclusions
Triangulating these three methods together creates validity within the research. The link analysis and the HTA together show how the user’s proficiency, resources and preferences affect the overall productivity of a task.
- Having a knowledge of the facility’s system allows a user to avoid errors while completing their task of purchasing groceries.
- The user’s resources also impact the task, if they are using a card without a chip and pin, the task will take longer and involve more steps. The use of cash can also add to the amount of steps in a task.
- Preferences and possibly proficiency of a user, impact the task as the user is able to choose the order of some of the steps in the task. That preference directly impacts the length of time of the overall task and can add more steps or actions needed in the task.
An example of this is the user’s preference of bagging the groceries; if the groceries are placed directly in the bag, instead of the bagging area, after they are recorded by the scanner, this eliminates the extra steps at the end of the transaction of then bagging the groceries from the bagging area to the bag. Lower proficiency with the machines also slows down productivity of the task, possibly causing errors to occur or steps to be repeated until the correct step is found to complete a task.
There is evidence from this study with the users attitudes about their overall experience, regardless of the number of errors that may occur or problems that happen during the task, users will continue to use this technology. Research seems to suggest that despite user’s perceived barriers of SST, their overall experience using the technology will be positive.
